Financial Statement Analysis
- Dividend Ratios
- Ratio Analysis (17+)
- Liquidity Ratios (29+)
- Turnover Ratios (17+)
- Profitability Ratios (66+)
- Efficiency Ratios (7+)
- Debt Ratios (26+)
Related Courses
Clik here to view.
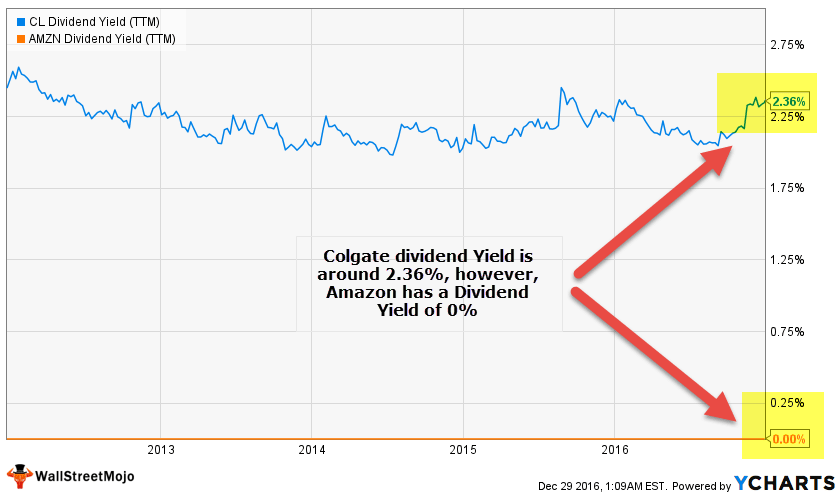
The dividend yield ratio in financial terminology which indicates how much a firm is paying out in dividends each year in relation to its market share price. As we can see from the above chart, Colgate has a dividend yield of around 2.36%, however, Amazon pays no dividends and has a dividend yield ratio of 0%. Why?
In this article, we look at the nuts and bolts of Dividend Yield Ratio –
- What is Dividend Yield Ratio?
- Dividend Yield Ratio Example
- Dividend Yield Ratio – Understanding Income vs Growth Investors
- Forward Dividend Yield Ratio & Trailing Dividend Yield Ratio
- Importance of Dividend Yield Ratio Stocks
- Why Stocks May have a Higher Dividend Yield Ratio?
- High Dividend Yield Ratio Sectors
- Conclusion
What is Dividend Yield Ratio?
This dividend yield ratio is expressed as a Percentage.
Dividend Yield ratio Formula = Annual Dividends Per Share / Market Price Per Share.
Yields for the current year are generally estimated since the prior year’s dividend yield or latest quarter yield (annualised for the year) and division with the current share price.
Dividend yield ratio is a way to measure the amount of cash flow ploughed back for every amount invested in the equity position. As there is no presence of accurate capital gains information available, this yield on dividend acts as a potential Return on Investment for a given stock. It is also represented as a company’s total annual dividend payments divided by its market capitalisation, assuming the number of shares is constant.
Recommended Courses
Dividend Yield Ratio Video
Dividend Yield Ratio Example
Joe’s Bakery is an upscale bakery which sells a variety of cakes and baked products in the United States. Joe’s is listed on a smaller stock exchange and current market price per share is $36.
As of the previous year, Joe’s paid $18,000 in dividends with 1,000 shares outstanding. Thus, the yield computed is:
Dividend Per Share = $18,000 / 1000 = $18.0
Dividend Yield Ratio Formula = Annual Dividend Per Share / Price Per Share
Dividend Yield Ratio = $18/$36 = 50%.
This means that the investors for the bakery receive $1 in dividends for every dollar they have invested in the firm. In other words, investors are getting 50% return on their investment for every year.
Dividend Yield Ratio – Understanding Income vs Growth
Let us take an example to understand this concept of Income vs Growth.
Company A’s stock is currently being traded at $25 and pays an annual dividend of $1.50 to its shareholders. On the other hand, Company B’s stock is trading at $40 in the stock market and also pays an annual dividend of $1.50 per share.
In this case, Company A’s dividend yield is 6% (1.50/25), while dividend yield for Company B is 3.75% (1.50/40).
Assuming all the other external factors remain constant, then an investor looking to make optimum usage from the client’s portfolio to supplement their income will prefer the portfolio of Company A as it has a higher yield in comparison to Company B.
Investors who target having a minimum cash inflow from their investment portfolio can ensure this by making investments in stocks which are known to pay relatively high and stable dividend yields on a regular basis. It is a debatable statement that high dividends come at a cost of growth potential of the firm. This is because every currency amount paid to the shareholders in the form of dividends is an amount that the company is not plowing back with an effort to increase its market share. While being paid for retaining a stock in the form of dividends may appear attractive to many (income), shareholders can earn a higher return if the value of their stock increases while they are holding on to it (growth). Hence, when a company pays dividends, it is coming at a cost.
Dividend Yield Ratio Example – Growth vs Income
For instance, Company ABC and Company PQR are both valued at $5 billion, half of which comes from 25 million publicly held shares worth $100 each. Also, assuming that at the end of Year 1, the two companies earn 10% of their value or $1 billion in revenue. Company ABC decides to pay half of these earnings ($500 million) in dividends to its shareholders, paying $10 for each share in order to have a dividend yield of 10%. The firm also decides to re-invest the other half to make some capital gains, increasing the value of the firm to $5.5 billion ($5billion + $500million) and appeasing to its income investors. Company PQR, on the other hand, decides to issue no dividends and reinvest all of its earnings into capital gains, thereby raising PQR’s value to $6 billion ($5billion + $1 billion) likely encouraging the growth investors.
Dividend yields are a measure of an investment’s productivity and some view it like a Rate of interest earned on an investment. When companies are paying large dividends to their shareholders, it can give an indication on various aspects of the firm, such as the firm may be currently undervalued or it is an attempt to attract new and large number investors. On the flip side, if a firm pays little or no dividends, it can give an indication, the company is overvalued or is attempting to enhance the value of its capital. Certain firms in specific industries, when they are established and earning steadily, often indicate healthy yields on dividends despite being overvalued e.g. banks and utilities especially government controlled.
While a company may be paying high dividends to its stakeholders over a steady period of time, the case may not always be the same. Companies often reduce their dividend distribution or halt them completely during difficult economic times or when the company is facing difficult times of its own, so one cannot expect dividends to be a regular phenomenon from a shareholders perspective.
Also, look at Dividend Discount model for Valuations
Forward Dividend Yield Ratio & Trailing Dividend Yield Ratio
One can also anticipate the future dividend payment of a company, either by using the most recent annual dividend payout made by the firm or considering the most recent quarterly payment and multiplying the same by 4 to arrive at an annualized figure. Popularly known as “Forward Dividend yield” it has to be used very cautiously since these estimates will always be uncertain. One may also compare such dividend payments in relation to the stock’s share price using a trend of the past 12 months to understand the history of the performance. Technically, it is referred to as the “Trailing Dividend Yield”.
Forward Dividend Yield Ratio
A forward dividend yield is an estimation of a particular year’s dividend declared which is expressed as a percentage of the current market price. The projected dividend is measured by taking the stock’s latest dividend payment and annualizing the same.
The forward dividend yield is computed as Future Dividend Payment / Current Market Price of Share.
For instance, if a company pays a dividend in Q1 of 50 cents and assuming the firm will pay a constant dividend for the rest of the year, then the firm is anticipated to pay $2 per share in dividends for the rest of the year. If the stock price is $25, the forward dividend yield is [2/25 = 8%]
Trailing Dividend Yield Ratio
The opposite of a forward dividend yield is a “Trailing dividend yield” which shows a company’s actual dividend payments in relation to its market share price of the previous 12 months. In a situation, where the future dividends are not predictable, this method of yield determination can be relatively useful as a measurement of value.
Importance of Dividend Yield Ratio Stocks
Dividend Paying Stocks are Stable
Dividend paying stocks are very stable. It is pivotal to observe, that one should keep a track only of those shares which are constantly offering dividends to its shareholders. If a stock offers a high dividend in the first year and subsequently the yield is low or inconsistent then such stocks should not be considered under the ambit of high dividend yielding. Historically, market prices of dividend paying stocks weaken relatively lesser than various stocks having a lower Beta. The benefit of such stocks can stay tall during times of crisis when the stock market falls as they provide stability. The reason is they continue to extract dividends even in depressed market conditions and additionally such stocks tend to recover quickly from a downfall in the market. Hence, rather than selling many investors prefer to buy such dividend yielding stocks.
Resilience to Market Crash
There will be a relatively large number of buyers for dividend yielding scripts than sellers as they are more lucrative. During scenarios of a crash, market price of stocks tends to fall but such dividend stocks will want to stand tall in the market by continuing to offer a reasonable amount of dividends. Investors will have a preference to buy dividend yielding stocks during a stock market slump to their portfolio.
Preferred by Value Investors
Value investors consider high dividend yield ratio as a strong value indicator. If a quality stock is yielding high dividend then it is considered as undervalued. Improvement of sales and profit figures are one of the strongest fundamental indicators of quality stocks. An ideal situation from an investor’s perspective will be high profitability and low debt. Such a situation though will exist during maturity stage of a firm. Normally, in developing countries, such a situation is not easily available and most companies are keen on leveraging high amount of debts on their balance sheets.
Considered Mature Companies
Companies which distribute its profits on a regular basis consistently in the form of dividends are considered established or saturated companies. This establishment comes with a predictability of future earnings. Firms will never want to adjust its short-term liquidity to woo investors and shareholders. Generally, when dividends are paid it is an indicator that they are in complete control of its liquidity position. Once its current liabilities are paid off, only then a firm can be in a position to offer dividends to its shareholders.
Reinvesting dividends enhances Yield
Re-investing dividend further enhances the yield. Investors must invest in a systematic manner to accumulate dividend yielding stocks. This way not only they accumulate fundamentally strong stocks to their portfolio but also increase overall dividend earnings. It is equally critical to reinvest dividend that flows in as this excess money can be used for purchasing more dividend stocks which are cyclical in nature. More stocks mean more dividends, which again is used for buying more stocks.
Why some Stocks have a Higher Dividend Yield Ratio?
If one looks at the subprime mortgage downfall during 2007-09, some companies were offering dividends in the range of 10%-20% encouraging the customers to cling on the stocks, but that was only because the market price of stock had seen a downward spiral, which resulted in higher dividend yield ratio. While analyzing a high dividend yield stock, it’s always important to determine the reason for high yield of a stock.
There are 2 reasons why a stock may have an above average yield:
#1 – The market price has taken a brunt
When a stock price falls quickly and the dividend payout remains equal, the dividend yield ratio tends to increase. For instance, if stock ABC was originally $60 with a $1.50, its dividend yield ratio would be 2.5%. If the stock price falls to $50 and the $1.50 dividend payout is maintained, its new dividend yield will be 3%. It is to be noted that on the face of the situation, the dividend yield may appear to attract dividend investors; it is actually a value trap. It is always important to understand the high yield of a stock. A firm which shows a stock price falling from $50 to $20, then it is perhaps struggling, and one should make detailed analysis before considering a plunge in the stocks.
#2 – Is it a MLP or REIT?
Master Limited Partnerships or Real Estate Investment Trusts are rapidly gaining popularity amongst dividend investors since they tend to offer substantially higher dividend yield ratios than equity stocks. These trusts tend to offer high dividends since they are required to distribute very large portion of their earnings (at least 90%) to shareholders in the form of dividends. These trusts do not pay regular income tax at the corporate level, but the tax burden is transferred to the investors.
High Dividend Yield Ratio Sectors
It is not a thumb rule, but generally the below industries are considered dividend friendly:
#1 – REIT Sector
The below graphs compares the dividend yield ratios of some of the RIETs in US – DCT Industrial Trust (DCT), Gramercy Property Trust (GPT), Prologis (PLD), Boston Properties (BXP) and Liberty Property Trust (LPT). We note that RIETs provide a stable dividend yield (2.5%-5.2% in the example below).
Image may be NSFW.
Clik here to view.
source: ycharts
#2 – Tobacco Sector
Tobacco sector in US has also shown some stable dividend yield ratios over the past 5-10 years. In the graph below, we compared Philip Morris Intl (PM), Altria Group (MO) and Reynolds American (RAI). We note that these companies have given stable dividends over the past 5-10 years.
Image may be NSFW.
Clik here to view.
source: ycharts
Like RIETs and Tobacco, other sectors like Telecommunications, Master Limited Partnerships and Utilities also tend to show relatively higher dividend yield Ratios.
Conclusion
As an investor, once should take note of the below points while maintaining dividend stocks in their portfolio:
- Dividend yield ratio is an important consideration for investors since it represents the annualized return a stock pays out in the form of dividends.
- Investors seeking income from dividend yielding stocks should maintain their concentration on stocks which have at least 3%-4% yield on a continuous basis.
- Investors should also consider the “Value Traps” which some stocks can offer in order to inflate their yields from dividends.
- Most of the stocks which offer dividends with a very high yield say 10% or so are considered very risky since a dividend cut is very much on the cards.
- Investors should carefully choose their stocks and not keep all stocks only which are high dividend yielding in nature as this can have a downside effect in the future.
- One should also consider other macroeconomic factors such as the Government policies put in place and also the economic and taxation policies which are in existence. If such policies are consistent, then its effects can be visible in the performance of the company and the overall industry.
Useful Post
- Importance of Dividends
- What is Limited Partnership (LP)?
- Formula of Financial Leverage
- TREND Function in Excel
- What is a Debt Yield?
- Ex-Dividend Date for Stocks
- Ratio Analysis Excel Templates
- Financial Leverage
- Operating Leverage Ratio
- Dividend Payout Ratio
- Capital Gearing Ratio
- Interest Coverage Ratio Analysis
The post Dividend Yield Ratio | Formula | Examples | Interpretation appeared first on .